What is the ROI of asset tracking for installed base visibility growth?
When your role is connected, directly or indirectly to the quality of IB Knowledge, it is naturally fair to wonder whether it makes economic sense for your business to deploy additional solutions in that area.
Here is what we’ve learned from the projects we’ve run with global leaders in industries as diverse as Robotics, Electrification, Industrial automation, and transport refrigeration.
-
The 1 to 1 ratio
The expected aftermarket revenue captured during its lifetime in service agreements, parts, and connected services is roughly equal to the asset price tag. But with better margins -
Complex channels
Global markets and channel structures make it hard to systematically and reliably gather quality knowledge about a majority of ultimate owners' locations and name -
Service revenue waterfall effect
Products are sold on the second-hand market after 6 to 8 years suddenly leaving manufacturers without aftermarket revenue for the product -
Preserving Warranty
Real-time shipment monitoring and assigning transport issues responsibility would save thousands of dollars every year in quality claims -
Trade Compliance
Finding out if an asset had been illegally shipped to embargoed or sanctioned countries, before it becomes a problem
Let's break it down into practical steps
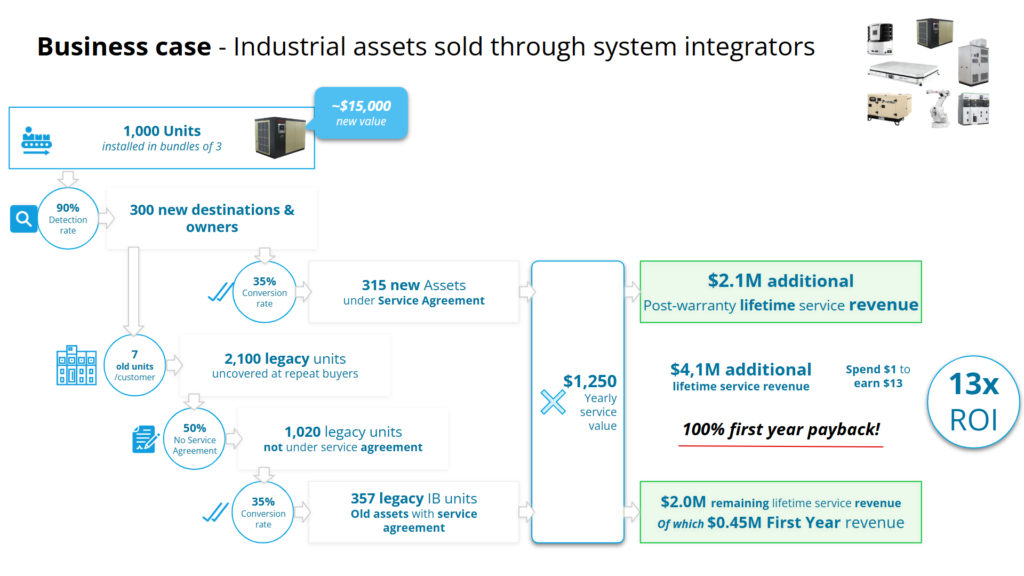
let’s take a piece of industrial equipment worth $15,000. It could be an MV Drive, an industrial Robot, an AMR, a DGA, a Reefer, a large pump, an industrial compressor, a powerful GenSet, a UPS or a Switchgear.
For ease of calculation, we’ll assume a 1000 units production and a 90% automated registration thanks to asset tracking.
Step 1. Shipment
1000 units installed in bundles of 3 (that’s the average installation bundle size at the final location)
Step 2. Registration
1000 units x 90% visibility / 3 units = 300 new asset owners detected and registered
Step 3. Old IB discovery
90% of asset owners are repeat buyers who own 7 similar units, on average. That’s a legacy installed base of 2100 old units already in service for typically 8 years or more.
If 50% of the old units are not under service and maintenance contracts, that’s 1050 units for which a new contract can be offered.
Step 4. Opportunity generation
So we now have 900 service opportunities for the new products and 1050 service opportunities for the uncovered legacy assets.
Step 5. Closing
With a closing rate of 35%, the 900 + 1050 new service opportunities would bring 680 new service contracts.
Assuming the lifetime service value from this piece of equipment is roughly equal to its catalog price ($15,000) and the asset’s serviceable lifetime is 12 years (after a 3 year warranty period), each year should generate approximately $1,250 in service, parts and subscription revenue.
Step 6. Billing
During the first year, the legacy assets’ service contracts would generate an additional $450,000 in revenue.
After the warranty period, the new assets’ service contract would generate $390,000 on a yearly basis.
Considering renewal rates, one year of production of one product line could return over $4,000,000 in additional service revenue over its lifetime, of which $2,000,000 in immediately accessible revenue from the old, uncovered installed base.
In a nutshell
For most industrial equipment, the lifetime service value is (more or less) equal to the catalog price.
A simple tracking device placed on or in the equipment will usually open the door to 15 to 20 years of service revenue per asset.
The ROI for this device and the Wisechain solution moves between $10 to $25 additional revenue for every $1 invested in the solution.
And it’s very easy to implement and use.
A pretty good deal, all things considered!